Consumption around the Globe, a look at per capita consumption, waste production, calories, and energy.
It takes the planet 1.5 years to restore what humanity burns through in a year.
Humanity is outstripping the Earth’s resources by 50 percent — essentially using the resources of one and a half Earths every year.
How are we at being stewards of the Earth’s environment?
Ecological footprint:
126 billion acres: amount of biologically productive land on earth
97 billion acres: amount of earth covered by low bio-productive oceans, deserts, ice caps, and human settlement
6.4 billion: human population
Dec. 29, 1970: the first time that human consumption outstripped the planet’s capability to produce. Since then the date has been creeping forward each year
How we live: The energy we use
Top energy users (by units of energy: MTOE):
China
U.S.
India
Russia
Japan
FACT: Americans constitute 5% of the world’s population but consume 24% of the world’s energy.
On average, one American consumes as much energy as
2 Japanese,
6 Mexicans,
13 Chinese,
31 Indians,
128 Bangladeshis,
307 Tanzanians
370 Ethiopians
Human waste of resources
In order from most to least, the top 10 greediest resource users per capita are:
1. Qatar
2. Kuwait
3. United Arab Emirates
4. Denmark
5. United States
6. Belgium
7. Australia
8. Canada
9. The Netherlands
10. Ireland
Qatar: The worst offenders: the typical resident requires the resources of 6.5X what the earth can produce.
United States: Each residents takes 4X the earth’s resources to support the global population.
UK: Consumes and produces waste at a rate 3.5 X greater than it can sustain.
China’s total ecological footprint is smaller, per capita, than in Europe or North America but its footprint is the heaviest in the world in raw size, because of its huge population.
Trash Champions of the World
Ireland: 1,675 pounds of garbage on average per person a year
United States: 1,630 pounds per person; the average American generates 52 tons of garbage by age 75.
Iceland: 1,610 pounds
Australia: 1,540 pounds
Denmark: 1,475 pounds
What we eat, and how much:
Dietary energy consumption per person around the world. The dietary energy consumption per person is the amount of food, in kcal per day, for each individual in the total population.
World: 2780 kcal/person/day
Developed countries: 3420 kcal/person/day
Developing World: 2630 kcal/person/day
Sub-Saharan Africa: 2240 kcal/person/day
Central Africa: 1820 kcal/person/day
Kilocalorie: A unit of measurement of dietary energy. One kcal equals 1,000 calories
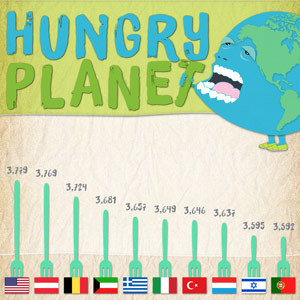
Calories consumed per capita: Top countries
Austria, 3800 calories a day
U.S. 3,770 calories a day
Greece, averaging 3710 calories.
Belgium 3690 calories.
Americans as a total population eat a total of 815 billion calories of food each day: roughly 200 billion more than needed – enough to feed 80 million people.
· Americans throw out 200,000 tons of edible food daily.
Americans have the largest disposable incomes in the world, but that doesn’t mean they’re dropping the most cash on the combined total of consumed food, alcohol and tobacco
Switzerland — $8,024 per person
Norway — $7,624 per person
Australia — $7277 per person
Japan — $6,556 per person
Sweden — $5,666 per person
New Zealand — $5,656 per person
Finland — $5,351 per person
Austria — $5,239 per person
Spain — $5,160 per person
Hong Kong — $5,128 per person
19. U.S. $4,431 per person
What we drink:
Water
159 gallons: The average individual daily consumption of water, while more than half the world’s population lives on 25 gallons.
Alcohol
5 drunkest countries in the world
Moldova, 4.81 gallons of liquor per person on average a year
Czech Republic: 4.35 gallons
Hungary: 4.30 gallons
Russia: 4.16 gallons, or 1,250 pints of beer, or 90 bottles of vodka
Ukraine: 4.12 gallons
Other heavy drinking countries include:
16. France: 3.61 gallons, or 500 glasses of wine
17. UK: 3.53 gallons, or 1,100 pints of beer
Americans, however, don’t drink as much liquor as people from other countries:
Alcohol:
2.5 gallons of liquor, on average per person a year
Sources:
Global Footprint Network provided some of the statistics cited.
http://www.nationmaster.com/
http://www.nationmaster.com/
http://
http://www.nationmaster.com/
http://news.discovery.com/
Statistics about the Earth’s resources: 2012 Living Planet Report, produced by the World Wildlife Fund (WWF).
http://www.cbsnews.com/2300-
http://public.wsu.edu/~mreed/
http://yearbook.enerdata.net/#
http://newsfeed.time.com/2013/


